SUMMARY
A carbon footprint is one of the most widely used — and widely misunderstood — concepts in the climate conversation. This article explains what it means, how it is measured, why the global picture is deeply unequal, and what understanding your own footprint can tell you about where change is most needed.The term “carbon footprint” entered public consciousness in the early 2000s, partly through a PR campaign by British Petroleum that encouraged individuals to calculate their personal climate impact. The concept has since become central to both individual behaviour change and organisational accountability — though its usefulness, limits, and political implications continue to be debated. Understanding it well is an essential part of climate literacy.
What Is a Carbon Footprint?
A carbon footprint is the total amount of greenhouse gases — primarily carbon dioxide (CO2) and methane (CH4) — generated by the activities of an individual, organisation, product, or nation, expressed in equivalent tonnes of CO2 (tCO2e). It is a holistic measure of climate impact, accounting not just for direct emissions from burning fuels but for the indirect emissions embedded in the goods we consume, the food we eat, and the services we use.
At the national level, carbon footprints are typically measured in two ways: production-based (or territorial) accounting, which counts emissions generated within a country’s borders; and consumption-based accounting, which adjusts for trade — counting the emissions associated with imported goods and subtracting those embedded in exports. The distinction matters significantly for understanding true climate responsibility: many rich countries have “outsourced” their carbon-intensive production to other nations.
The Global Numbers: A Picture of Stark Inequality
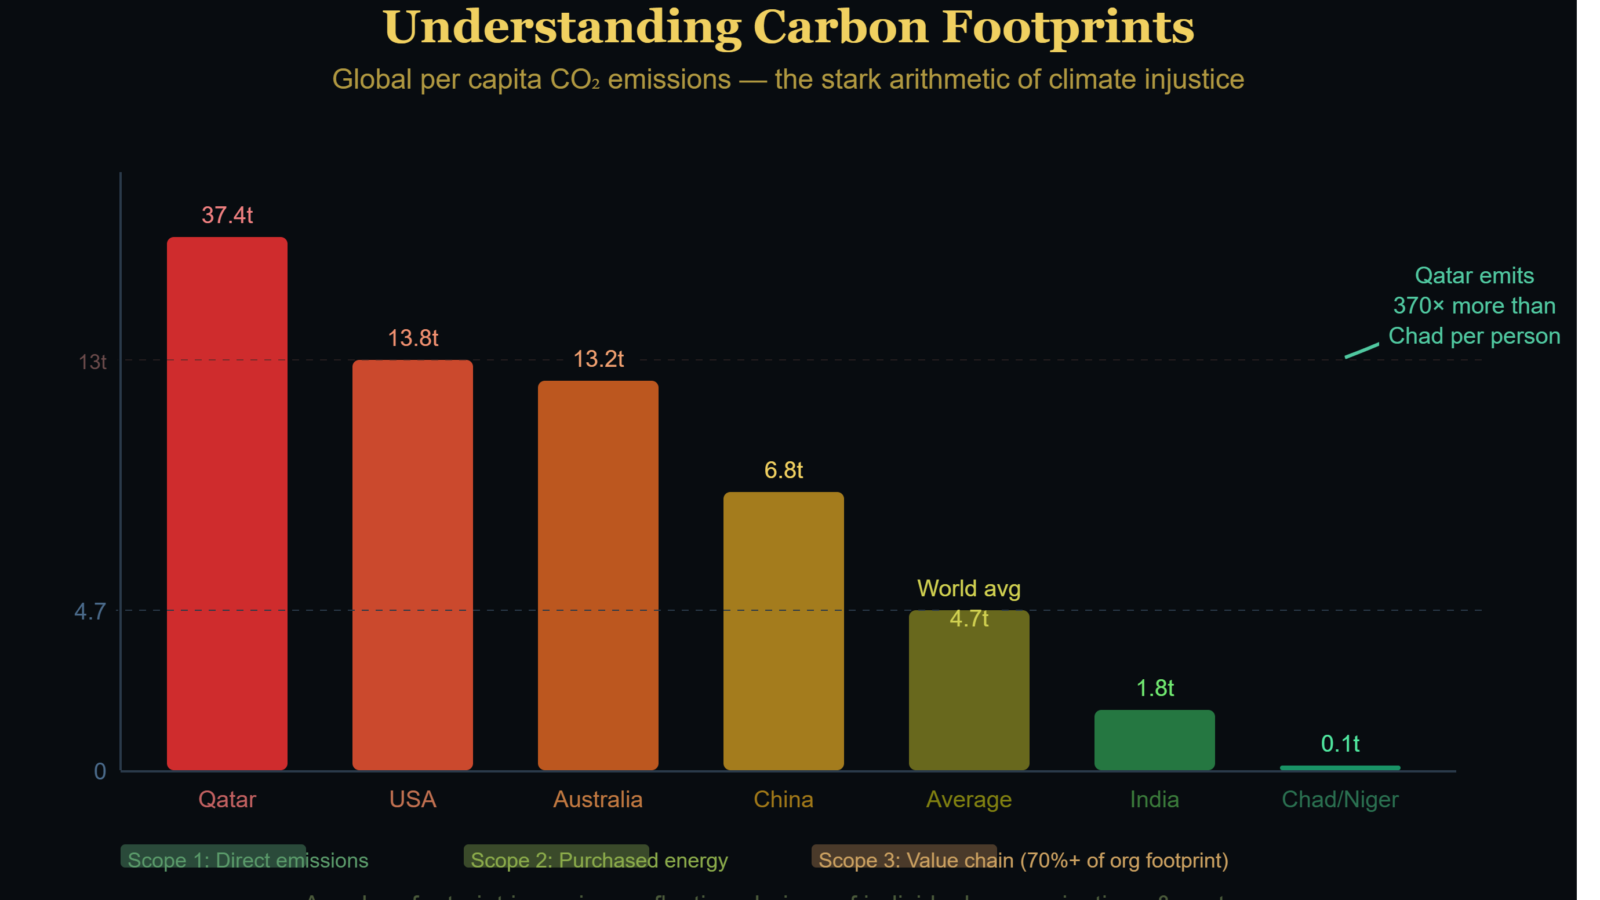
According to the Global Carbon Project, global per capita CO2 emissions averaged 4.7 metric tonnes in 2023 — a figure that conceals vast disparities. The United States emits approximately 13.8 tonnes per person annually, while Australia and Canada are similar. In contrast, the average person in Chad, Niger, or the Central African Republic emits around 0.1 tonnes per year — roughly 150 times less than a citizen of the United States or Australia. A person in the US or Australia produces in under two days the same amount of emissions that the average person in Mali generates across an entire year.
At the extreme high end, Qatar’s per capita emissions exceed 37 metric tonnes — the result of energy-intensive industry, high air conditioning demand in an extreme desert climate, and a relatively small population relative to its energy exports. Across the Middle East, per capita emissions remain among the world’s highest, while across Sub-Saharan Africa they remain among the world’s lowest.
“The average American or Australian produces the same amount of CO2 emissions in under two days as the average person in Mali or Niger does in an entire year. This is the defining arithmetic of climate injustice.”
Breaking Down a Personal Carbon Footprint
For individuals in high-income countries, the largest components of a personal carbon footprint are typically home energy use (heating and electricity), transportation (particularly private vehicle use and air travel), and food (especially the consumption of beef and dairy). A single long-haul return flight can add one to three tonnes of CO2 equivalent to an individual’s annual footprint — comparable to months of typical home energy use. Beef is particularly carbon-intensive: one kilogram of beef generates approximately 27 kg of CO2 equivalent, compared to 2.5 kg for chicken or 0.9 kg for tofu.
Home energy retrofits — insulation, double glazing, heat pumps, rooftop solar — can reduce household energy emissions by 50-80% over their lifetime. Switching from a petrol car to an electric vehicle can halve transportation emissions, even on a partially fossil-fuelled grid. Dietary shifts toward plant-rich eating can reduce food-related emissions by up to 73%, according to Oxford University research.
Organisational Carbon Footprints: The Three Scopes
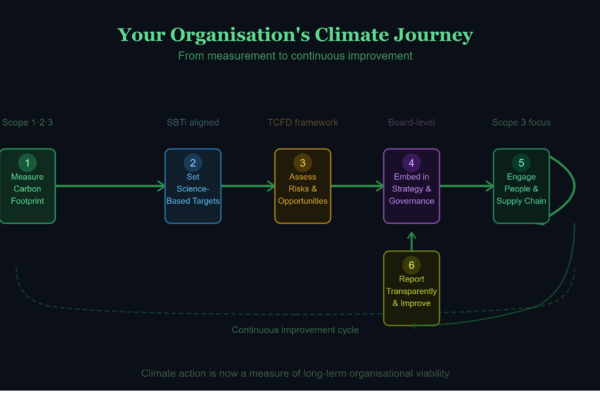
For organisations, the GHG Protocol Corporate Standard provides the globally accepted accounting framework, dividing emissions into three scopes. Scope 1 covers direct emissions from owned or controlled sources — company vehicles, on-site boilers, manufacturing processes. Scope 2 covers indirect emissions from purchased electricity, heat, or cooling. Scope 3 is the most expansive category, covering all other indirect emissions in a company’s value chain: purchased goods and services, business travel, employee commuting, waste, and the downstream use of sold products. For most large organisations, Scope 3 represents more than 70% of their total emissions footprint.
The growing global adoption of mandatory climate disclosure standards — including the ISSB’s IFRS S2 standard and the EU’s Corporate Sustainability Reporting Directive — means that organisations which cannot accurately measure and report their carbon footprint face growing regulatory and reputational exposure.
“A carbon footprint is not just a number. It is a mirror that reflects the choices — of individuals, of organisations, and of systems — that are driving the climate crisis and that hold the keys to solving it.”
Beyond Individual Footprints: The Systems Question
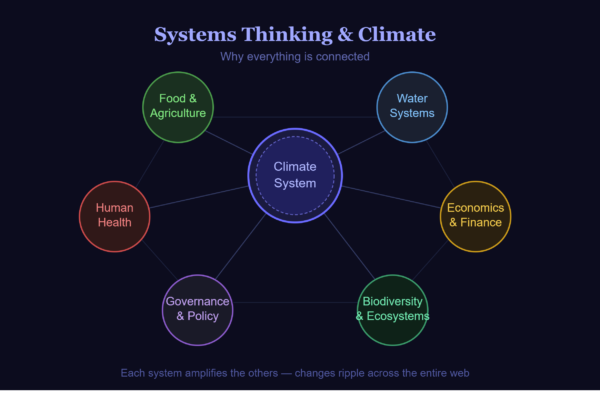
One important caveat to the carbon footprint discourse is the risk of using it to redirect responsibility from systems to individuals. The majority of global emissions are driven by energy infrastructure, industrial systems, agricultural practices, and policy choices that lie well outside any individual’s control. While personal action matters and sends market signals, sustainable emissions reductions at scale require systemic change — in energy systems, transport infrastructure, land use policy, and financial markets. Individual carbon footprints are most useful not as guilt-generators but as diagnostic tools: helping people and organisations understand where the greatest leverage for change exists.
Key References
- Global Carbon Project — Global Carbon Budget 2024
- Our World in Data — CO2 Emissions per Capita
- Statista — Average Per Capita CO2 Emissions Worldwide 1960–2023
- World Population Review — Carbon Footprint by Country 2026
- GHG Protocol — Corporate Value Chain (Scope 3) Standard
- Poore & Nemecek — Reducing food’s environmental impacts (Science, 2018)
- ISSB — IFRS S2 Climate-related Disclosures
- EU — Corporate Sustainability Reporting Directive (CSRD)
- Wikipedia — List of countries by CO2 emissions per capita